



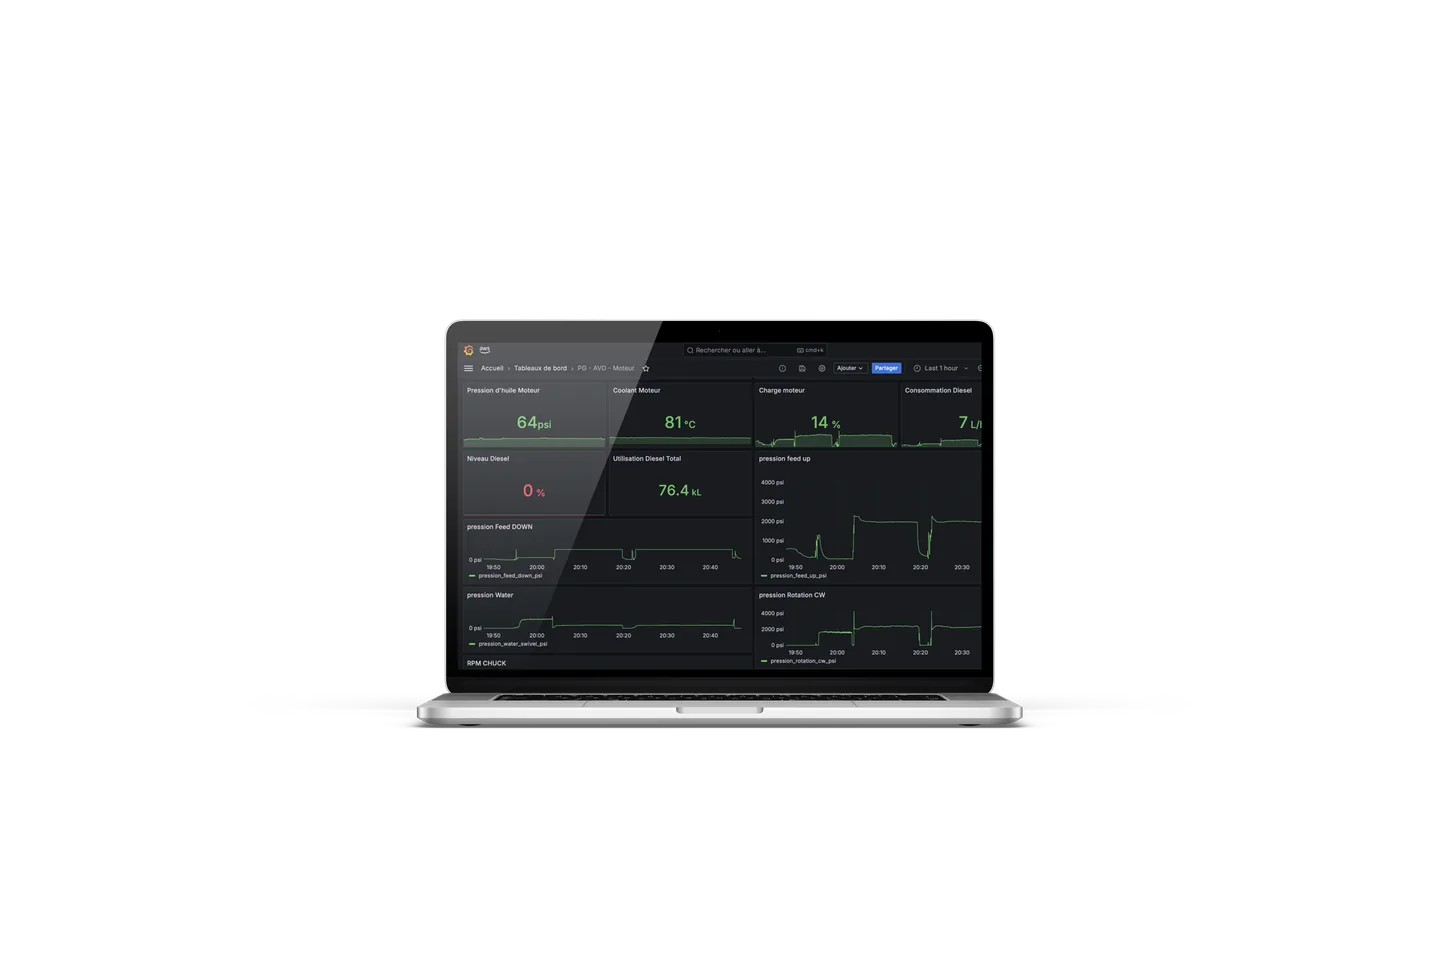
Dumont Nickel has to verify wind direction before every blast and monitor dust levels at three measuring stations. Those two checks condition its licence to operate. We brought them together in a single web application, built on a data warehouse that can grow.
One shared core, two uses: authorizing a blast, and seeing an exceedance coming.
Two regulatory obligations, a single data foundation
The engagement at a glance
| Scope | Two projects pooled into a single web application — strong technical overlap |
| Deliverable | Online application, optimized for phone and tablet |
| Data foundation | A data warehouse built to grow, open to new sources |
| Integrated sources | Weather stations, SoftDB platform, nearest public station |
| Measuring stations | Three — town of Launay, south sector, south‑east sector |
| Reading interval | Wind direction every 20 to 30 seconds |
| Duration | Roughly 9 to 13 weeks, in three stages |
| Out of scope | Infrastructure costs and post-project support |
The problem: the licence to operate is verified every single day
Continuously verifying environmental data and keeping that information traceable aren’t good practices: they are legal requirements. Wind direction at the moment of a blast, point limits and 24-hour cumulative averages at the three measuring stations — every data point has to be retrievable and defensible.
Managing dust emissions is also a commitment the organization makes to its host community. So it isn’t only a threshold not to cross, it’s a promise to keep.
Without a predictive tool, there is only so much you can anticipate about at-risk episodes. When an exceedance is observed instead of anticipated, the only move left is a blunt one: slow down or stop all operations, for lack of knowing which sector is responsible.

Seeing the exceedance coming over the next 24 hours means trading a site-wide stoppage for a sector-by-sector intervention.
The rule: what the regulation requires
Two distinct limits apply at all three stations: a point value never to be exceeded, and a 24-hour cumulative average.
- Point limit — a value never to be exceeded, station by station. TSP · PM2.5
- Cumulative average — the 24-hour rolling average counts as much as the instantaneous peak. 24 h
- Forecast window — weather forecasts arrive every 60 minutes; maximum and average values are interpolated across the next 24 hours. 60 min
- Anticipated exceedance — the crossing shows up in the forecast, before it is observed in the field. alert
The mechanism: authorizing a blast on wind direction
Three configurable restriction zones, and a status that only flips after five confirmed readings.
- Exclusion zones — three configurable sectors on the site base map. 3 zones
- Wind direction — re-read every 20 to 30 seconds and displayed in near real time, alongside equipment positions. 20–30 s
- Five confirmed readings — the status only turns green after five confirmed readings outside the exclusion zones. 5 / 5
- Trigger time — the authorized blast is timestamped and filed into the compliance record. timestamped
What the application does
Eight functions, two uses, a single data foundation.
Real-time collection
Wind direction and dust levels recorded continuously, station by station — wind every 20 to 30 seconds, TSP and PM2.5 at the three stations.
Map interface
Exclusion zones, blasts, stations and equipment positions are configured on the site base map, with wind direction in near real time.
Blast authorization
A clear status, green or red, based on the configured rules — five confirmed readings outside the zones — with the trigger time recorded.
Seismic and public data
Retrieval of seismic data from the integrated SoftDB platform and of readings from the nearest public weather station.
Compliance reports
Generated per blast or by date — location, technical parameters, weather and seismic data — and archived in an internal database for traceability.
Forecasting and interpolation
Weather forecasts integrated every 60 minutes, with maximum and cumulative average values interpolated across the next 24 hours.
Exceedance alerts
A visual alert as soon as a regulatory threshold risks being crossed, with the location of operating equipment so at-risk sectors can be targeted.
Accounts and access
User management through standard authentication, compatible with the single sign-on systems already in place.
What it changes
Before. An exceedance is observed after the fact, and stopping all operations can become the only move left.
After. The risk of exceedance is read in the forecast, and the intervention happens sector by sector, before the crossing.
- One build for two projects — the shared core is designed, tested and maintained once rather than twice.
- Compliance held, for blasts and for dust — verification is continuous and every data point stays retrievable.
- At-risk episodes are read in the forecast — the crossing is anticipated across the next 24 hours instead of being observed.
- Intervention happens by sector — stopping all operations is no longer the only recourse.
- Compliance reports generate themselves — answering a requirement no longer means reassembling the data by hand.
- The data warehouse stays open — new sources and new uses graft onto it without rebuilding the foundation.
How it ran: three stages, roughly nine to thirteen weeks
Only the engagement’s total duration is fixed. The breakdown below is an indicative schedule: the split between stages is set during framing.
| Stage | What happens | What comes out |
|---|---|---|
| 1. Analysis and structure W0 – W2/W3 | Framing both streams, compliance rules, restriction zones and the structure of the data warehouse. | Data structure validated |
| 2. Development and continuous testing W2 – W7/W9 | Building the shared core, the map interface, the authorization rules and the forecasting, tested as it went. | Application tested continuously |
| 3. Delivery and training W7 – W9/W10 | Go-live, switching the data sources to production, and training the operations teams. | Tool in service, teams trained |
Technical make-up
- Responsive web app — phone and tablet
- Scalable data warehouse
- Mapping interface
- SoftDB integration — seismic data
- Weather stations and public data
- SSO-compatible authentication