

The mandate covers two aspects of internal logistics at an operating underground mine: traffic on the access ramp, and remuck inventory tracking. Both were addressed through simulation, built on real site data and an interactive 3D visualization. The first stream compares layout and traffic-management scenarios for the ramp connecting the orebody to the shaft infrastructure. The second continuously estimates the inventory of each ore or waste pile from equipment positioning and sensors already present on site.
The site already produces the necessary data; what was missing was a way to read it before the decision is made.
Two streams, one data foundation
| Scope | Two aspects of underground logistics, addressed through a single simulation approach |
| Stream 1 | Access ramp traffic and passing bays |
| Stream 2 | Continuous estimation of remuck inventory |
| Deliverables | Configurable simulators, 3D visualization, dashboard and a layout recommendation |
| Data | Equipment positioning and sensors already present on site |
| Out of scope | Dedicated instrumentation of the piles; automated traffic control, left to a later phase |
The challenge: underground logistics is still run by eye
Between the stope and the mill, two points escape measurement. Both come down to the same cause: the information exists on the ground, but not at the moment the decision is made.
The access ramp
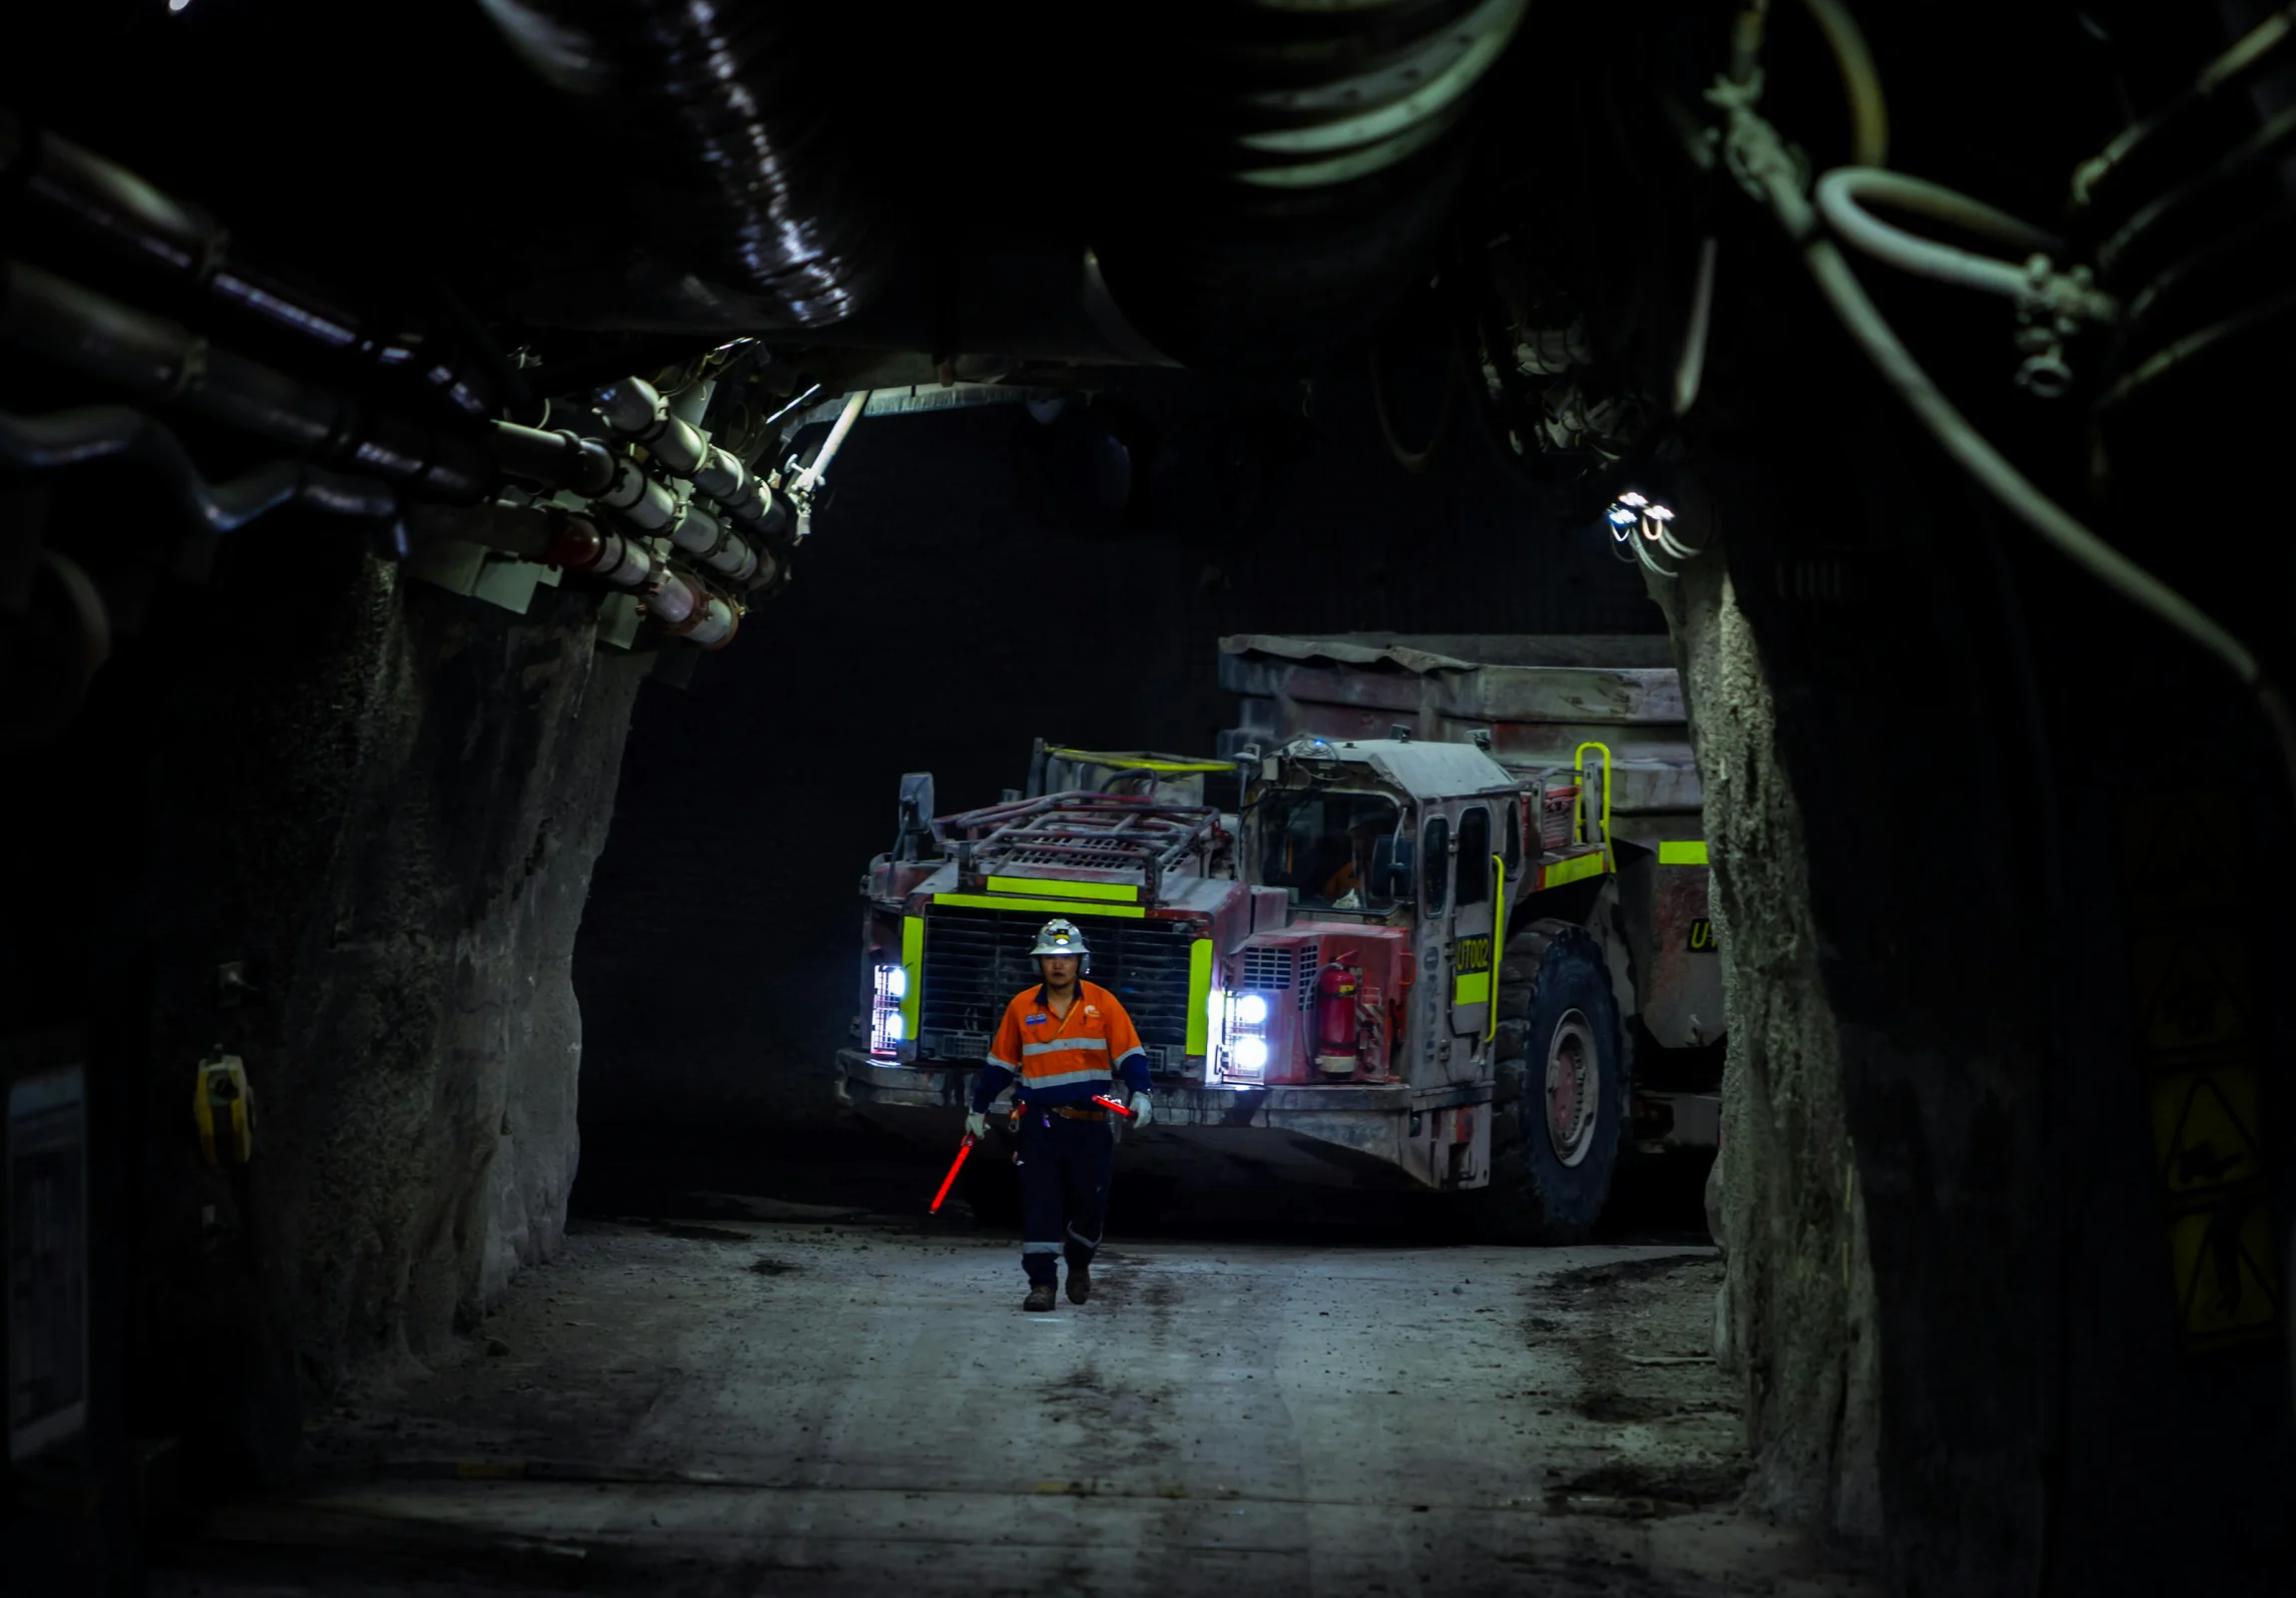
The ramp is heavily used and still under development; it does not allow vehicles to pass one another. Priorities are settled by eye, when two vehicles meet. Traffic mixes production trucks and light vehicles in every direction, with no traffic management system. Hence the inefficiencies and operational risks, and the need for a layout decision grounded in hard evidence rather than habit.
The remucks
The inventory of each remuck remains a black box between what leaves the stopes and what enters the mill. Instrumenting the piles directly, with fixed LiDAR or a dedicated weighbridge, is rarely viable: remucks move around in a harsh environment, and the cost per pile becomes prohibitive. Without reliable tracking, haulage planning is done blind, ore/waste contamination is detected late, and discrepancies against mill weights cannot be reconciled quickly.
The rule: what the site imposes before any calculation
The traffic simulator is only worth something if it replays the site’s actual rules. The ramp is single lane and meetings are resolved in the bays: each vehicle type has its priority rank, loaded vehicles travelling up go first, and the descending vehicle pulls into the nearest bay. Added to this are the physical constraints of the site: lane width, maximum speed, following distance, clearance within the bay, and the dimensions specific to each vehicle type. Queues and passing conflicts are modelled explicitly, not averaged out.
On the remuck side, the constraint is the opposite: nothing can be added to the piles. The model must work with equipment positioning from BLE beacons and with sensors already installed, namely the truck scale, LHD hydraulics, exit LiDAR and last zone visited.
The setup: simulate the ramp, estimate the piles
The first stream rests on a time stepped traffic simulation engine, deterministic and reproducible: the same configuration always yields the same result, which makes scenarios comparable with one another. A sweep optimization engine then systematically explores passing bay configurations, their number, their length and their position, crossed with traffic volumes.
The second stream estimates inventory through an interpretable Bayesian model: a hidden semi Markov model with conjugate priors. It returns not a single value but a confidence band, and it refines itself continuously through online learning on corrections from field experts. The data source (simulator, replay, or the site’s real time feed) can be hot swapped, with no code rewrite.
What the traffic simulator does
- Ramp modelling: single lane and passing bays, on a deterministic, reproducible time step.
- Site traffic rules: priority by vehicle type, priority to loaded vehicles travelling up, descending vehicles pulling into the nearest bay, queues and conflicts.
- Physical constraints: lane width, maximum speed, following distance, clearance within the bay, and dimensions by vehicle type.
- Sweep optimization: systematic exploration of the number, length and position of bays, crossed with traffic volumes.
- Decision indicators: throughput per shift, average and percentile wait times, queues, bay occupancy, feasibility of the target.
- 3D visualization and dashboard: fully configurable.
What the inventory estimator does
- Visit detection: geofencing, a state machine and a minimum dwell time to recognize that a piece of equipment has stopped at a remuck.
- Operation classification: dumping or loading, by Bayesian inference, with Monte Carlo propagation of tonnage uncertainty.
- Contamination alert: early detection of an ore and waste mix, flagged to the operator before dumping.
- Meeting anticipation: tunnel conflicts identified from proximity beacons, with priority arbitration.
- Continuous reconciliation: comparison of estimated inventory against actual mill weights.
- Hot swapping: switching between simulated data, replay and the real time feed without a restart.
- Online learning: Bayesian priors updated through expert annotation, with periodic retraining.
The impacts
Before. Passing priorities are settled by eye, at the moment vehicles meet, and remuck inventory remains a black box between the stope and the mill.
After. The layout configuration is chosen on simulated, compared scenarios, and every pile carries a continuous estimate with a confidence band.
On the ramp side
- A justified configuration: the recommendation retains the minimal layout that meets the target number of trips per shift, backed by compared scenarios.
- Fewer decisions made by eye: passing priorities no longer depend on the moment of the encounter.
- Flow at the lowest development cost: the production target is met without oversizing the ramp.
- A foundation for what comes next: the same results serve as the basis for future automated control through light signalling.
On the remuck side
- Continuous visibility with no dedicated sensor: every remuck carries an estimate, drawn from instrumentation already in place.
- Contamination intercepted before dumping: the alert arrives before the action, not after the fact.
- Discrepancies that become readable: reconciliation against mill weights reveals theft, loss in transit or a faulty sensor.
- A move to live data without rewriting: the estimator, the visualization and the dashboard are agnostic to the source.
Technical composition
| Traffic simulation | Deterministic time stepped simulation engine and sweep engine |
| Inventory estimation | Interpretable Bayesian model, hidden semi Markov model with conjugate priors, with conformal calibration of the confidence bands |
| Learning | Online learning and periodic retraining by deterministic annealing |
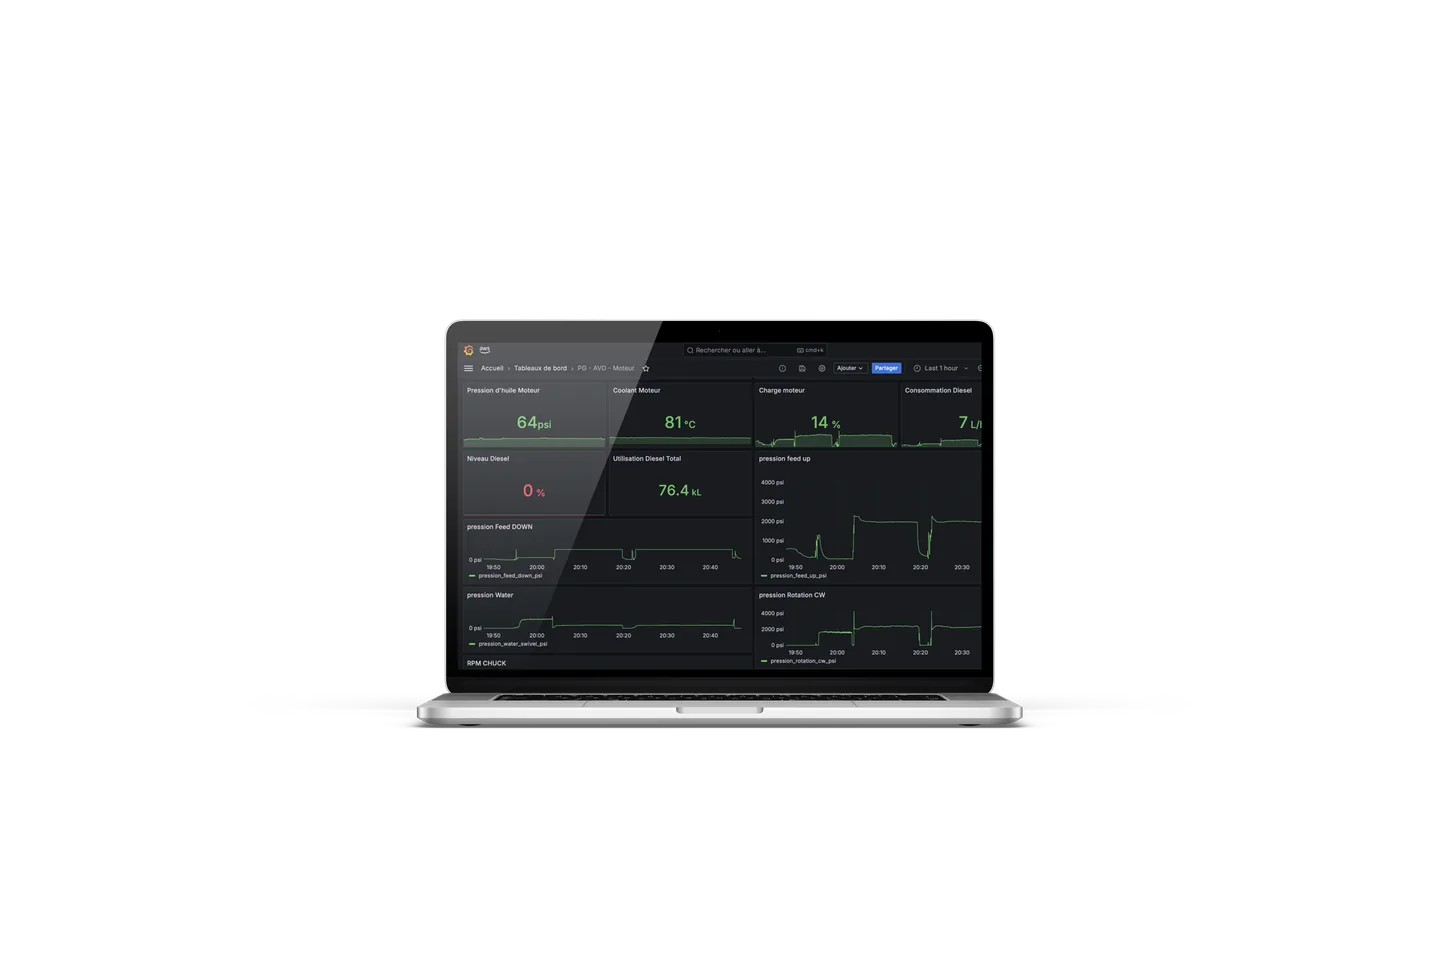
| Interfaces | Real time API, interactive 3D visualization and configurable dashboard |